This article explains how to review and interpret training metrics for a Custom Extraction trained with DocuWare IDP. It shows how to access training results, evaluate performance on template and field levels, and identify areas for improving model accuracy.
Article scope
This article covers the DocuWare IDP platform and its features. DocuWare configurations are not covered here.
Getting started
1. Open the dashboard
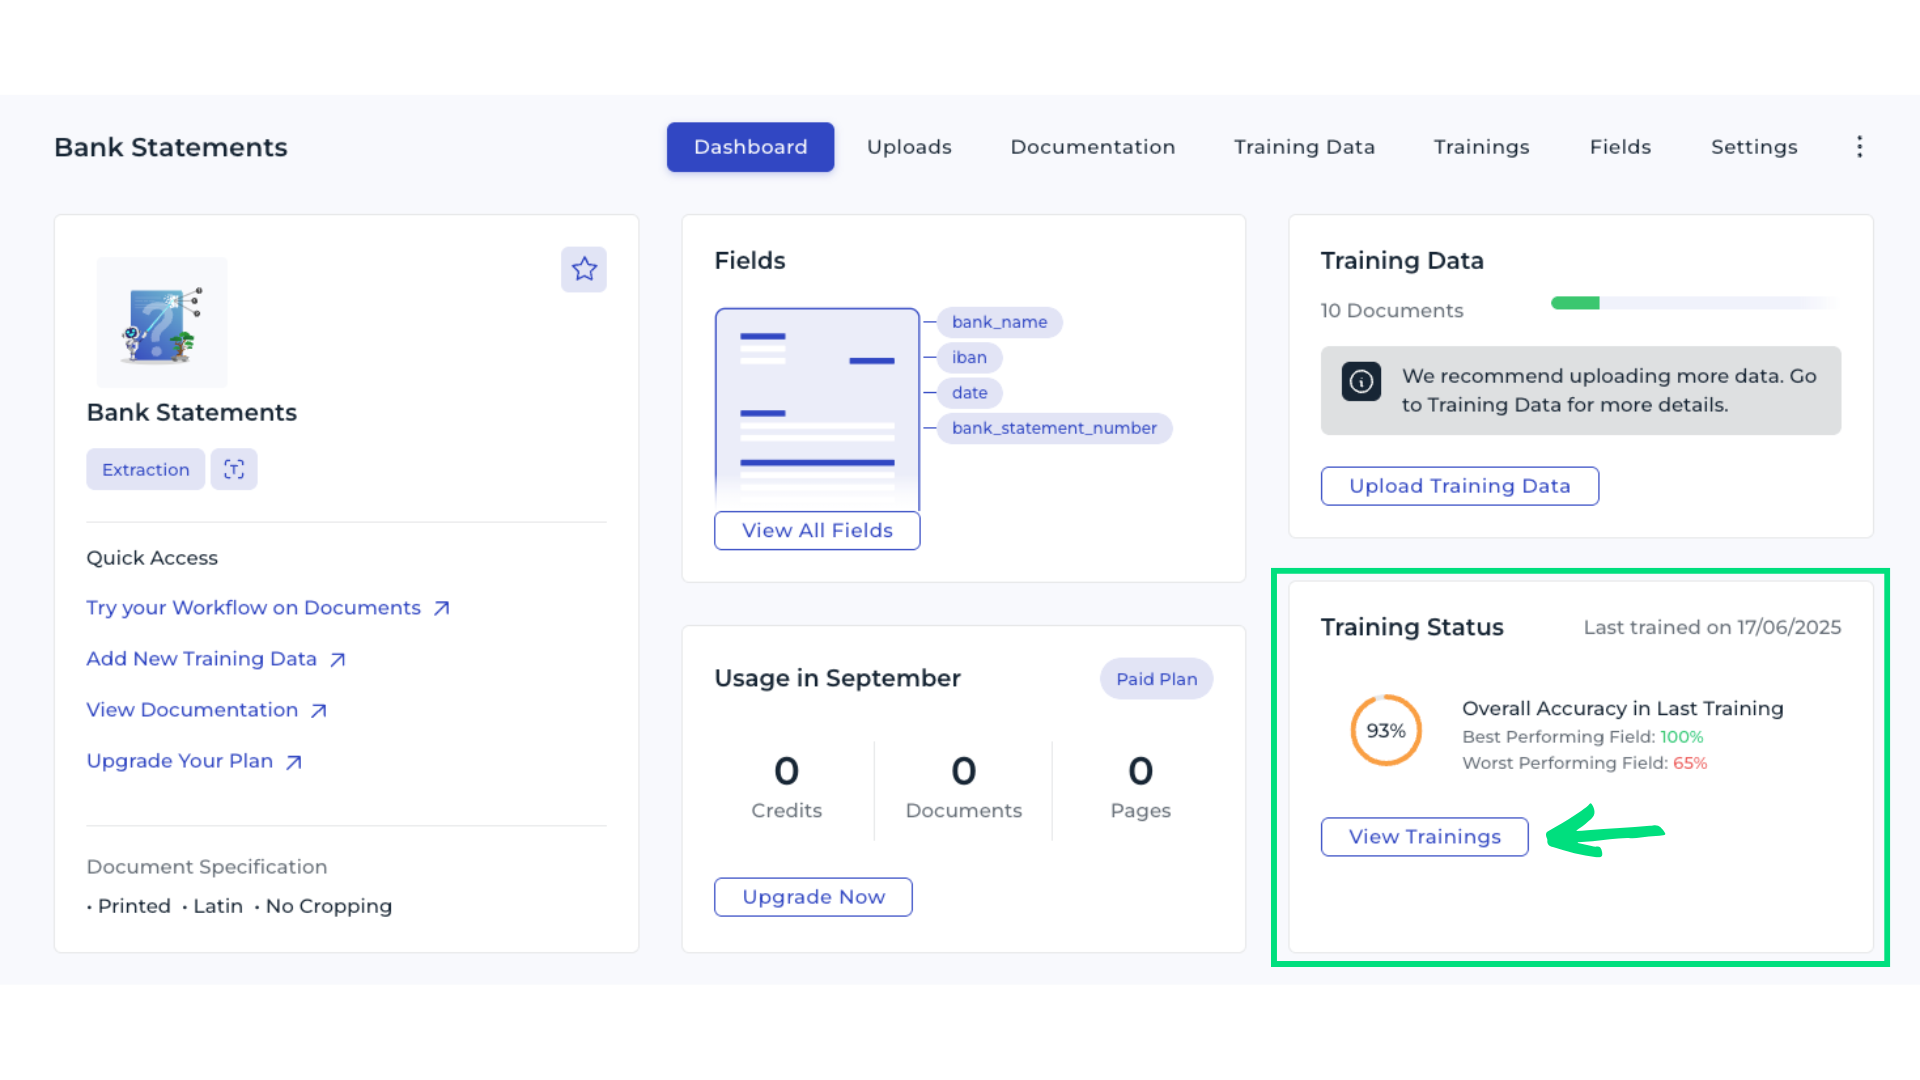
Navigate to your Custom Extraction in DocuWare IDP. In the Training Status section, review the initial model’s performance overview. Remember, the model should improve with each new round of reviewed or added data. Select View Trainings to open the list of training runs.
2. Review overall accuracy
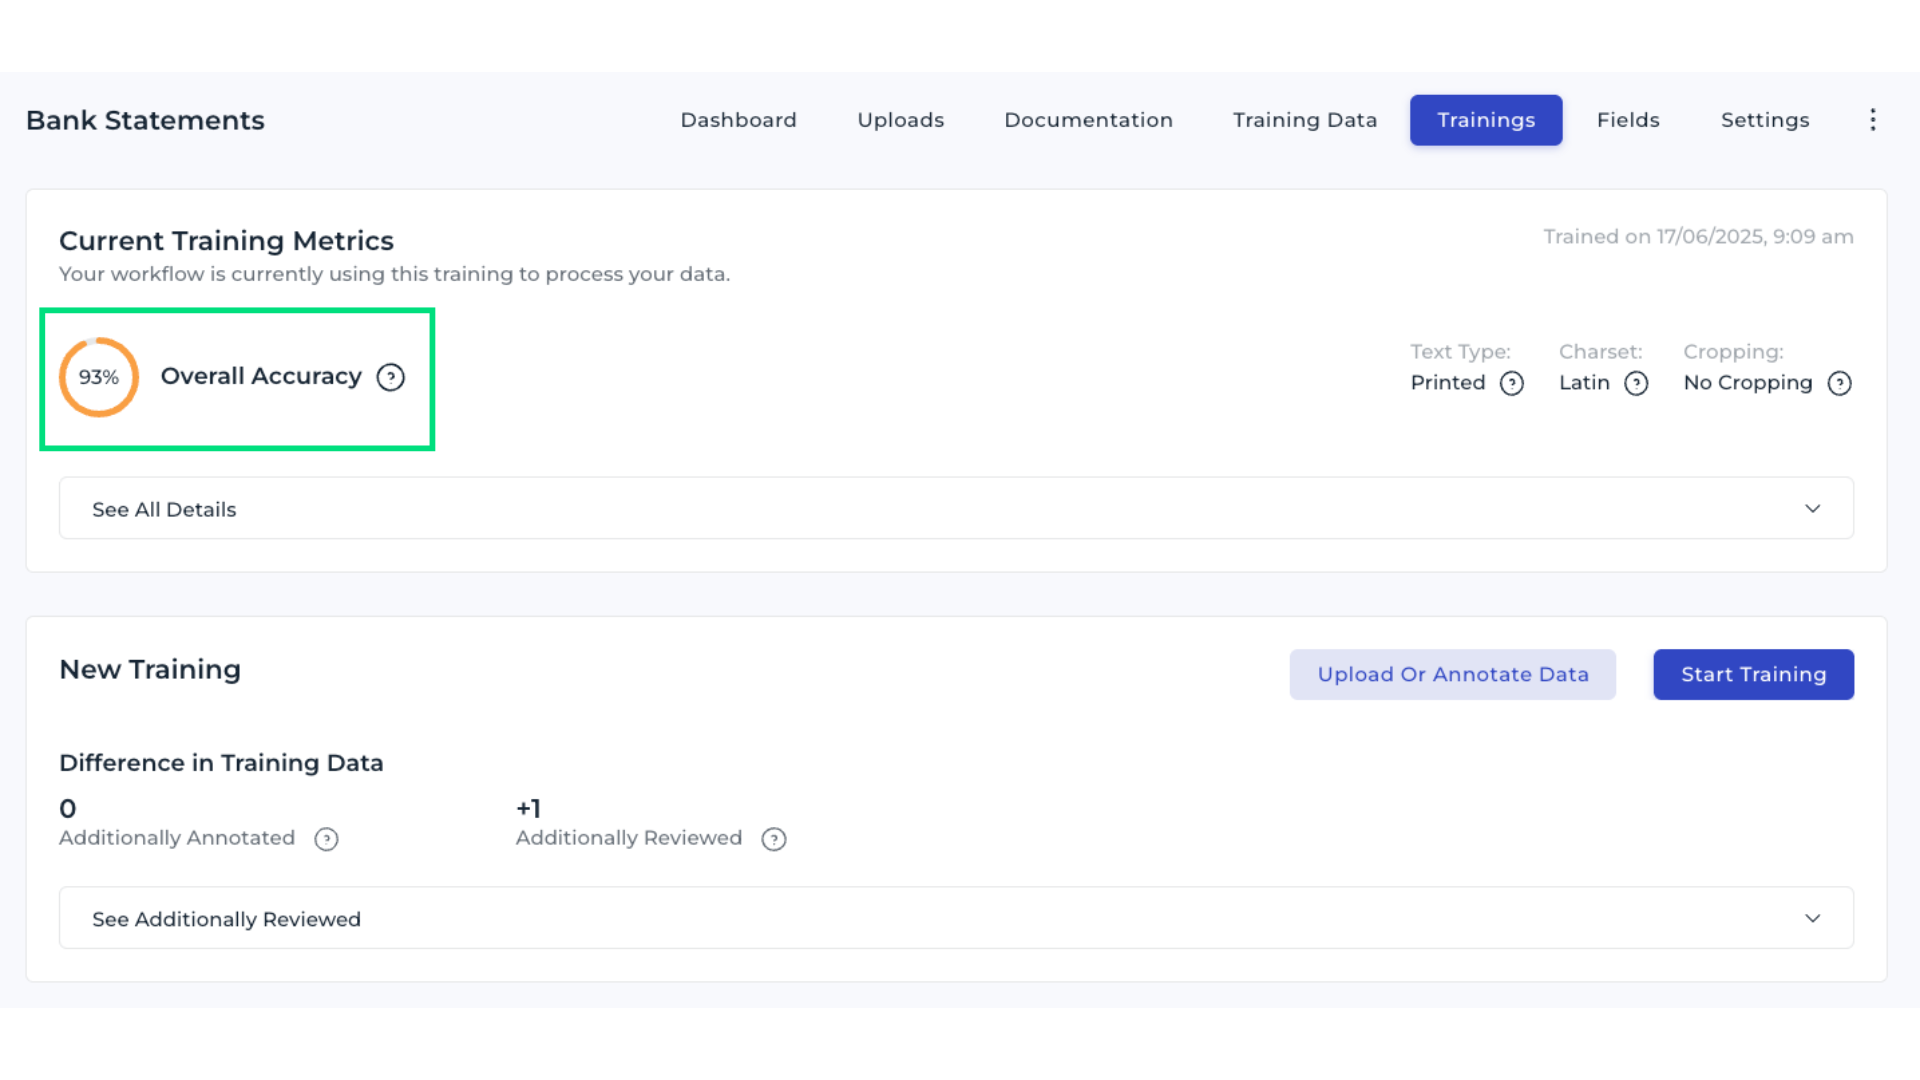
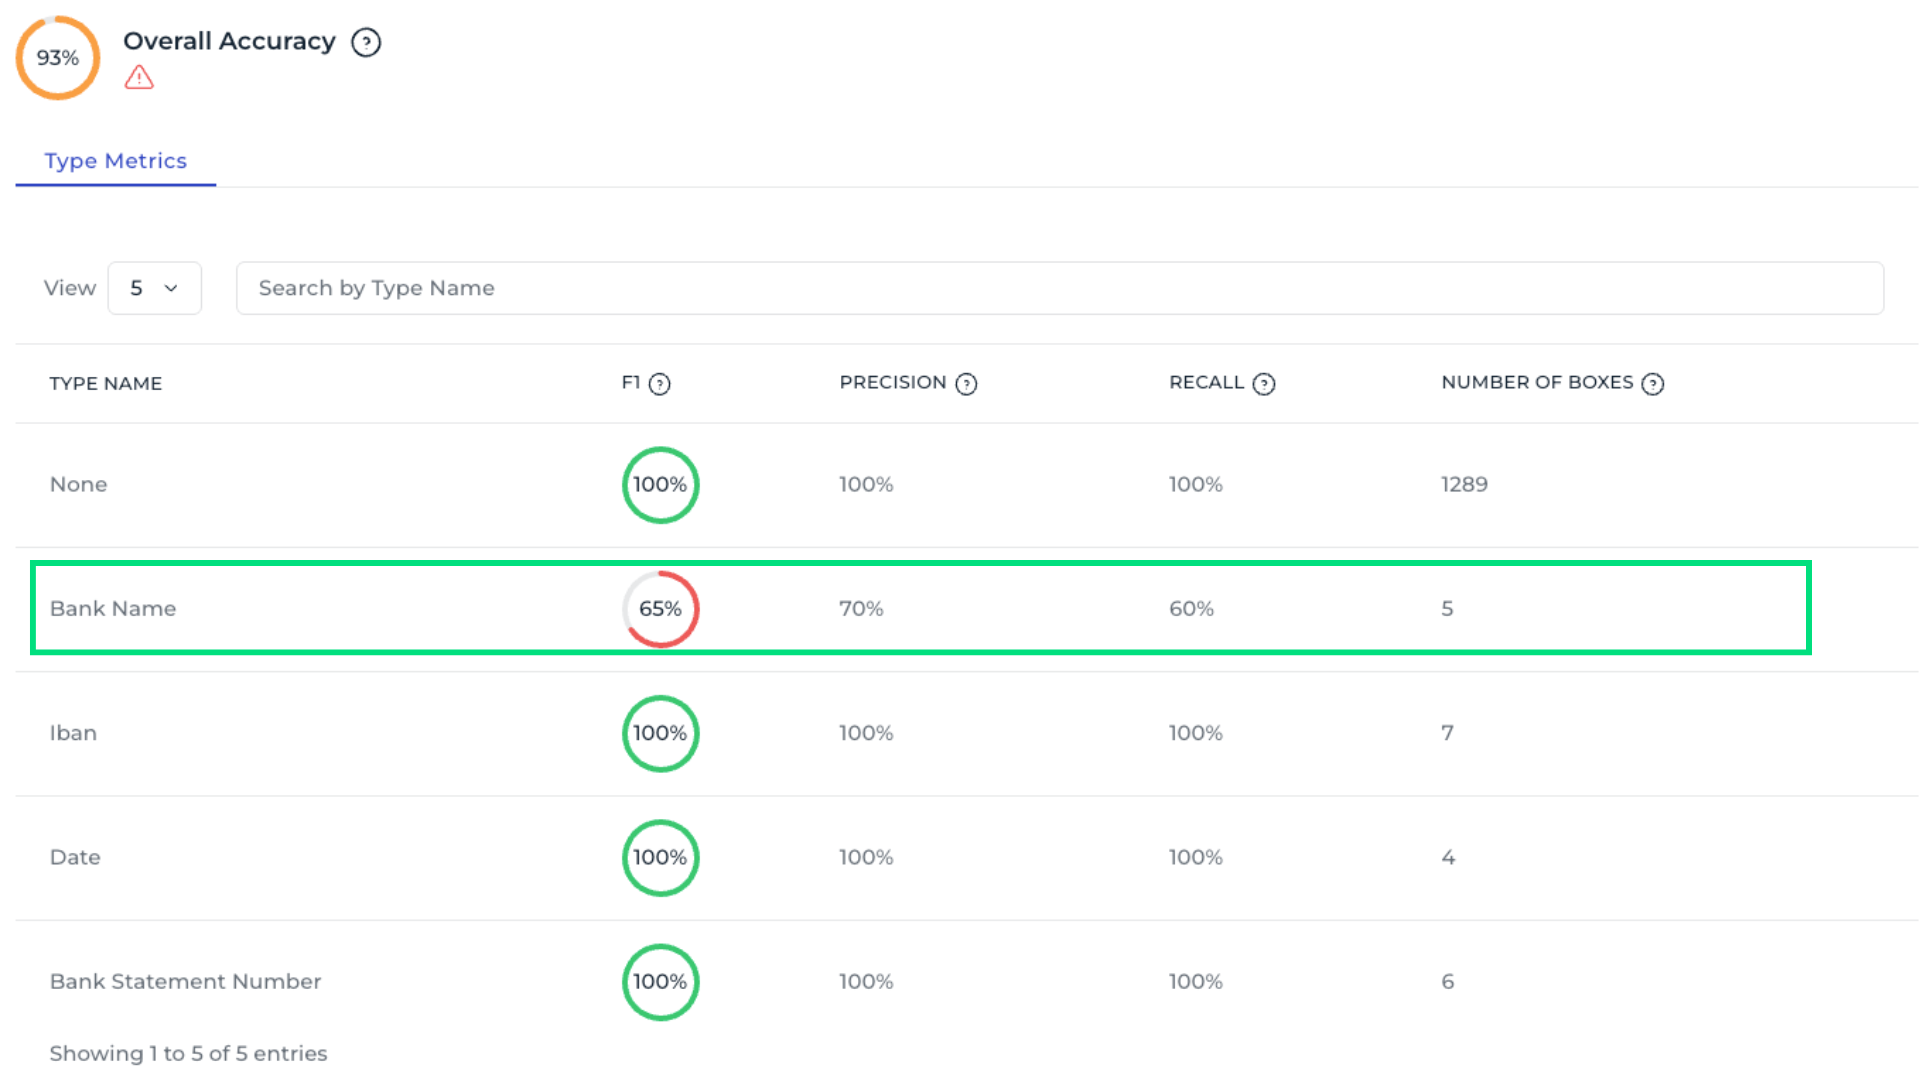
The Overall Accuracy metric shows how many bounding boxes were correctly detected, indicating how often the model predicts your data fields correctly. For example, an accurancy of 93 % means the model still has room for improvement. Question mark icons next to each metric provide additional explanations.
3. Evaluate template-level metrics
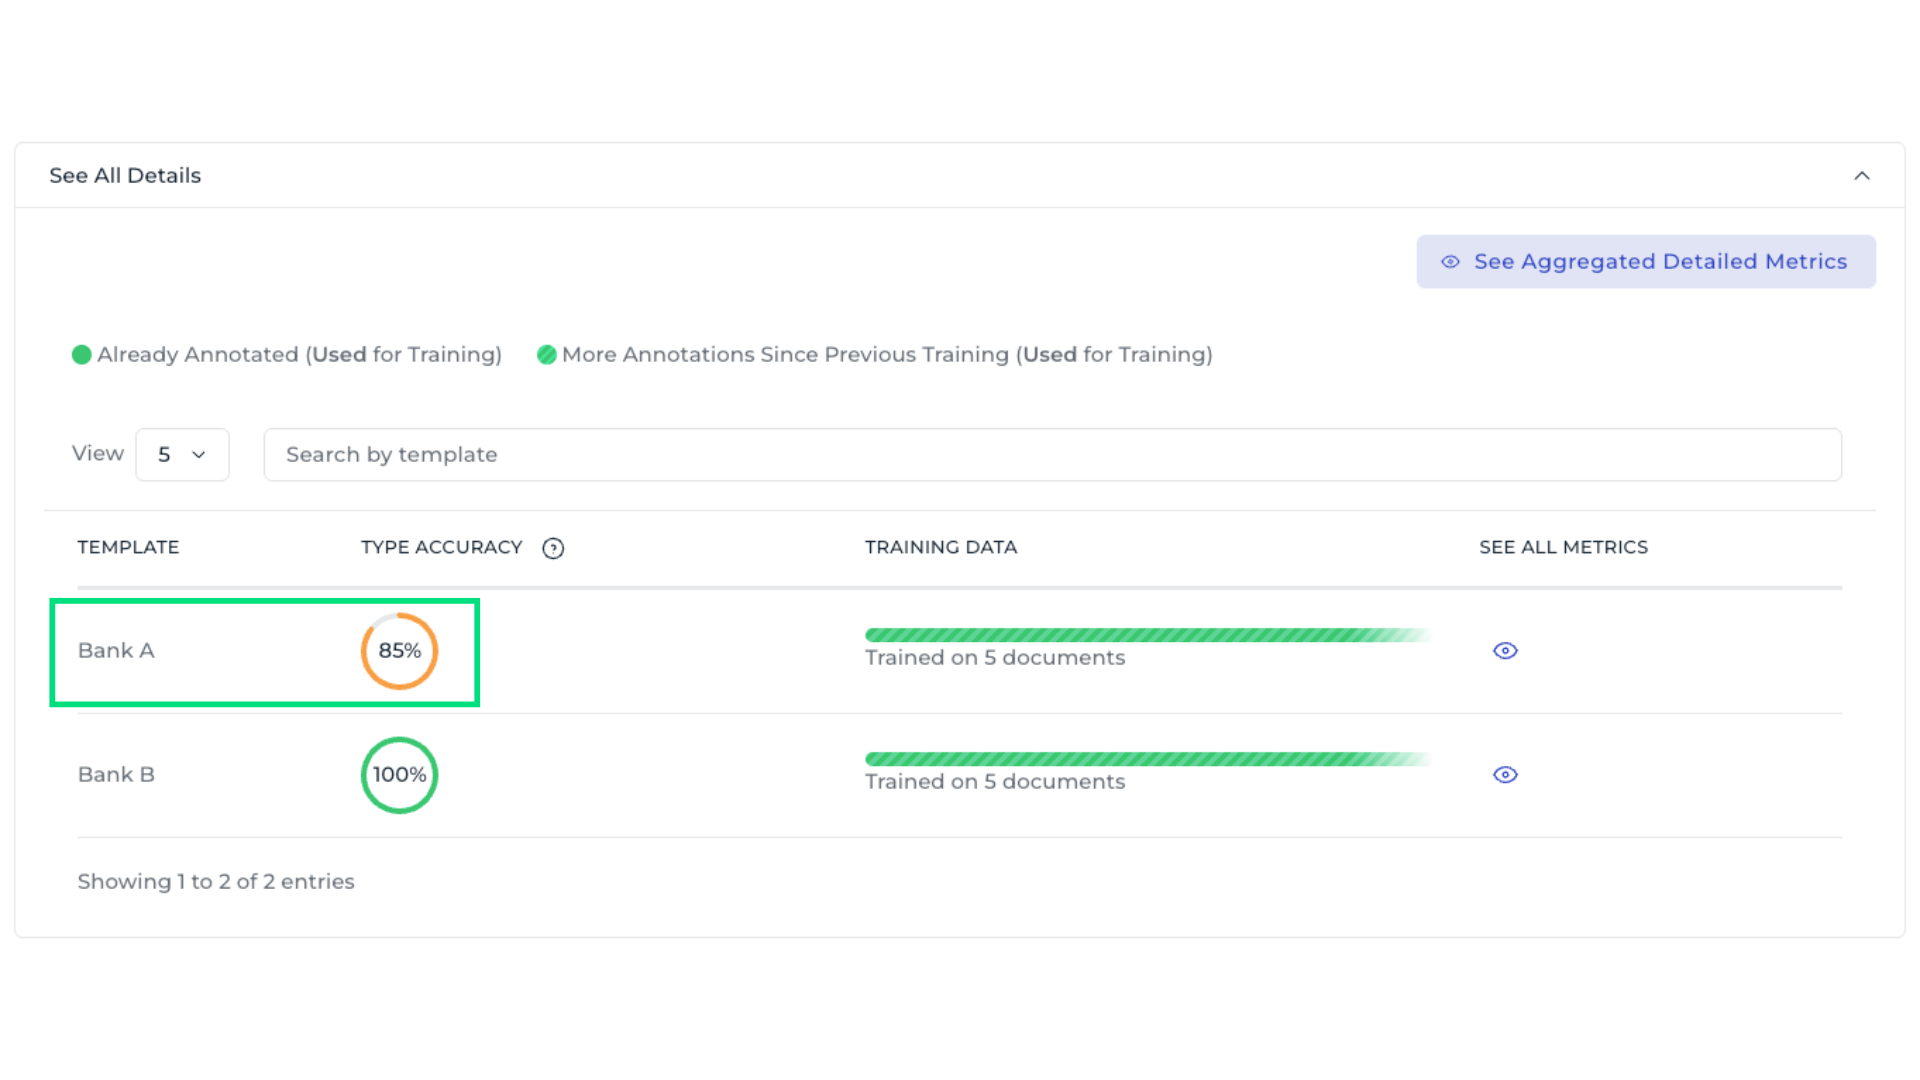
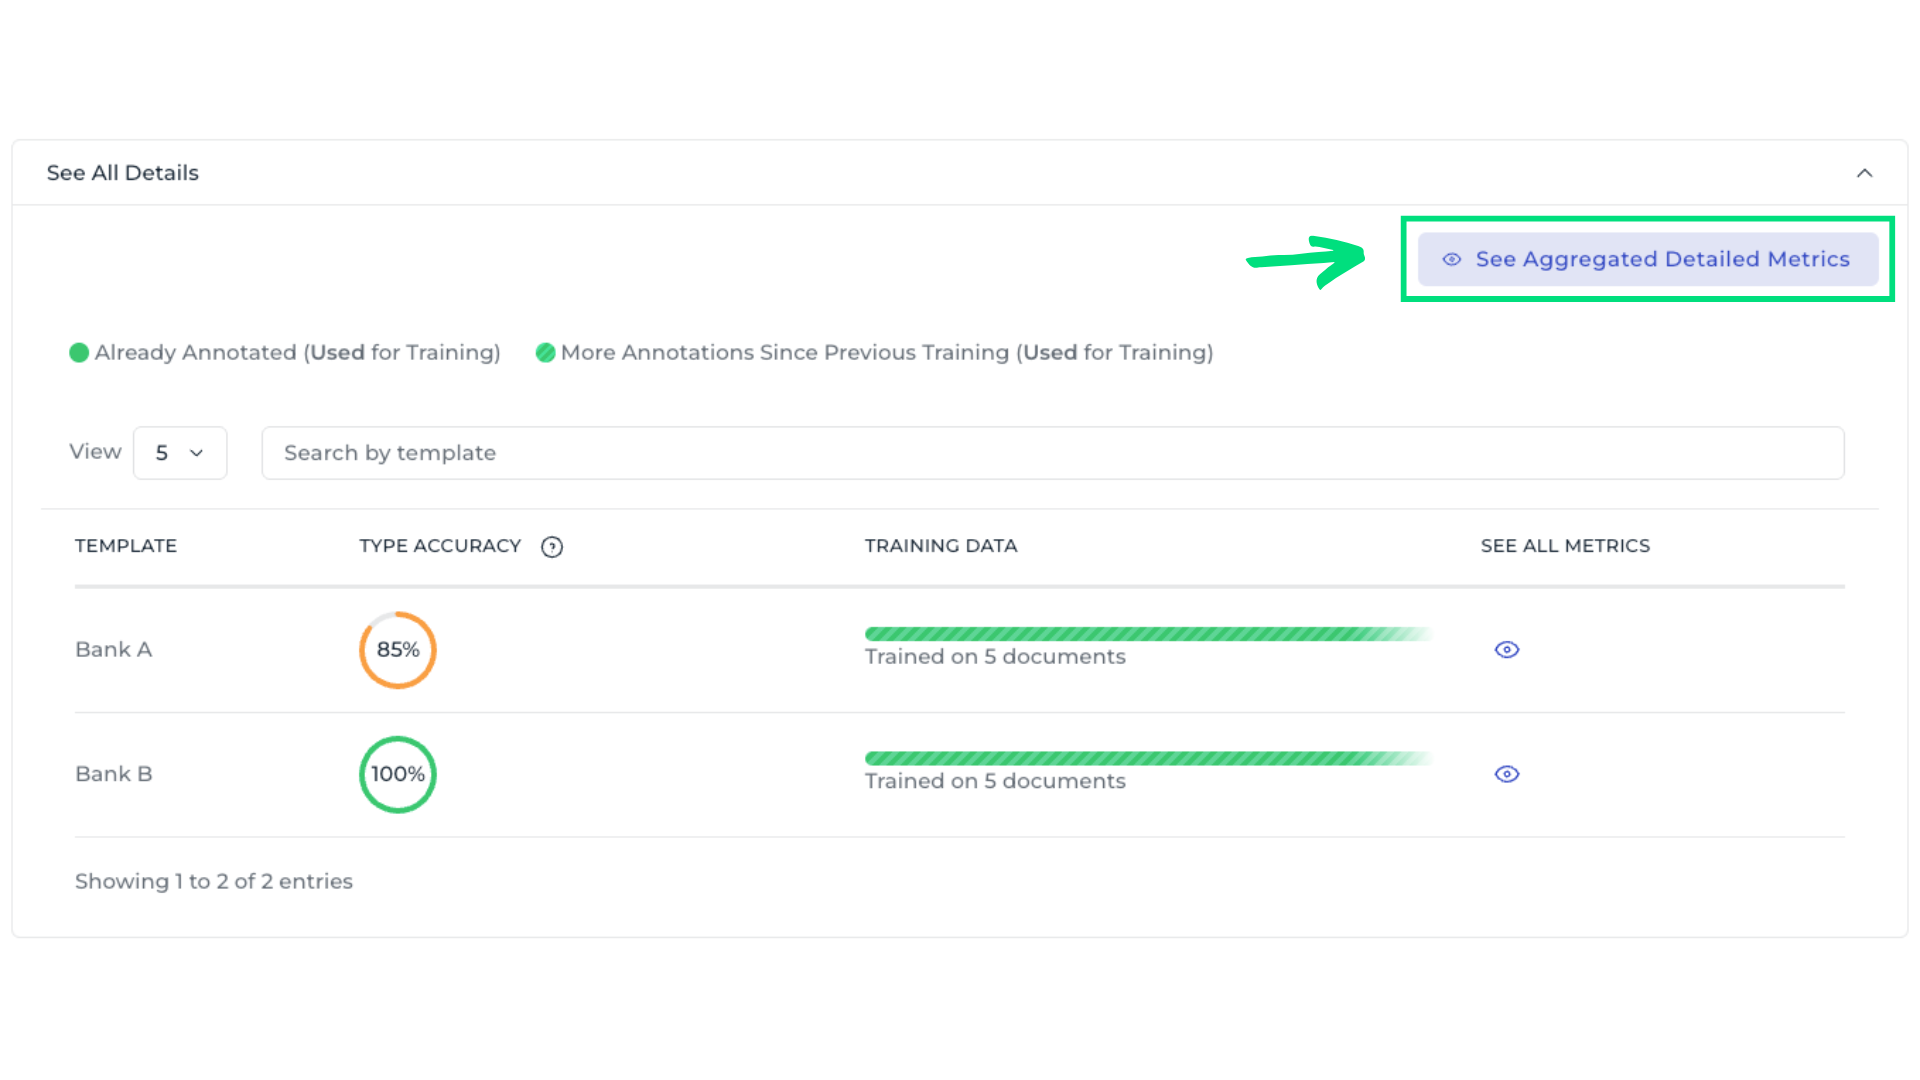
This summarizes the model’s performance across all templates. It helps determine whether specific templates are underperforming, allowing improvement efforts to focus where they are most needed. Templates with low accuracy are immediately visible. To inspect all fields within a template, select the eye icon.
4. Analyze field-level metrics
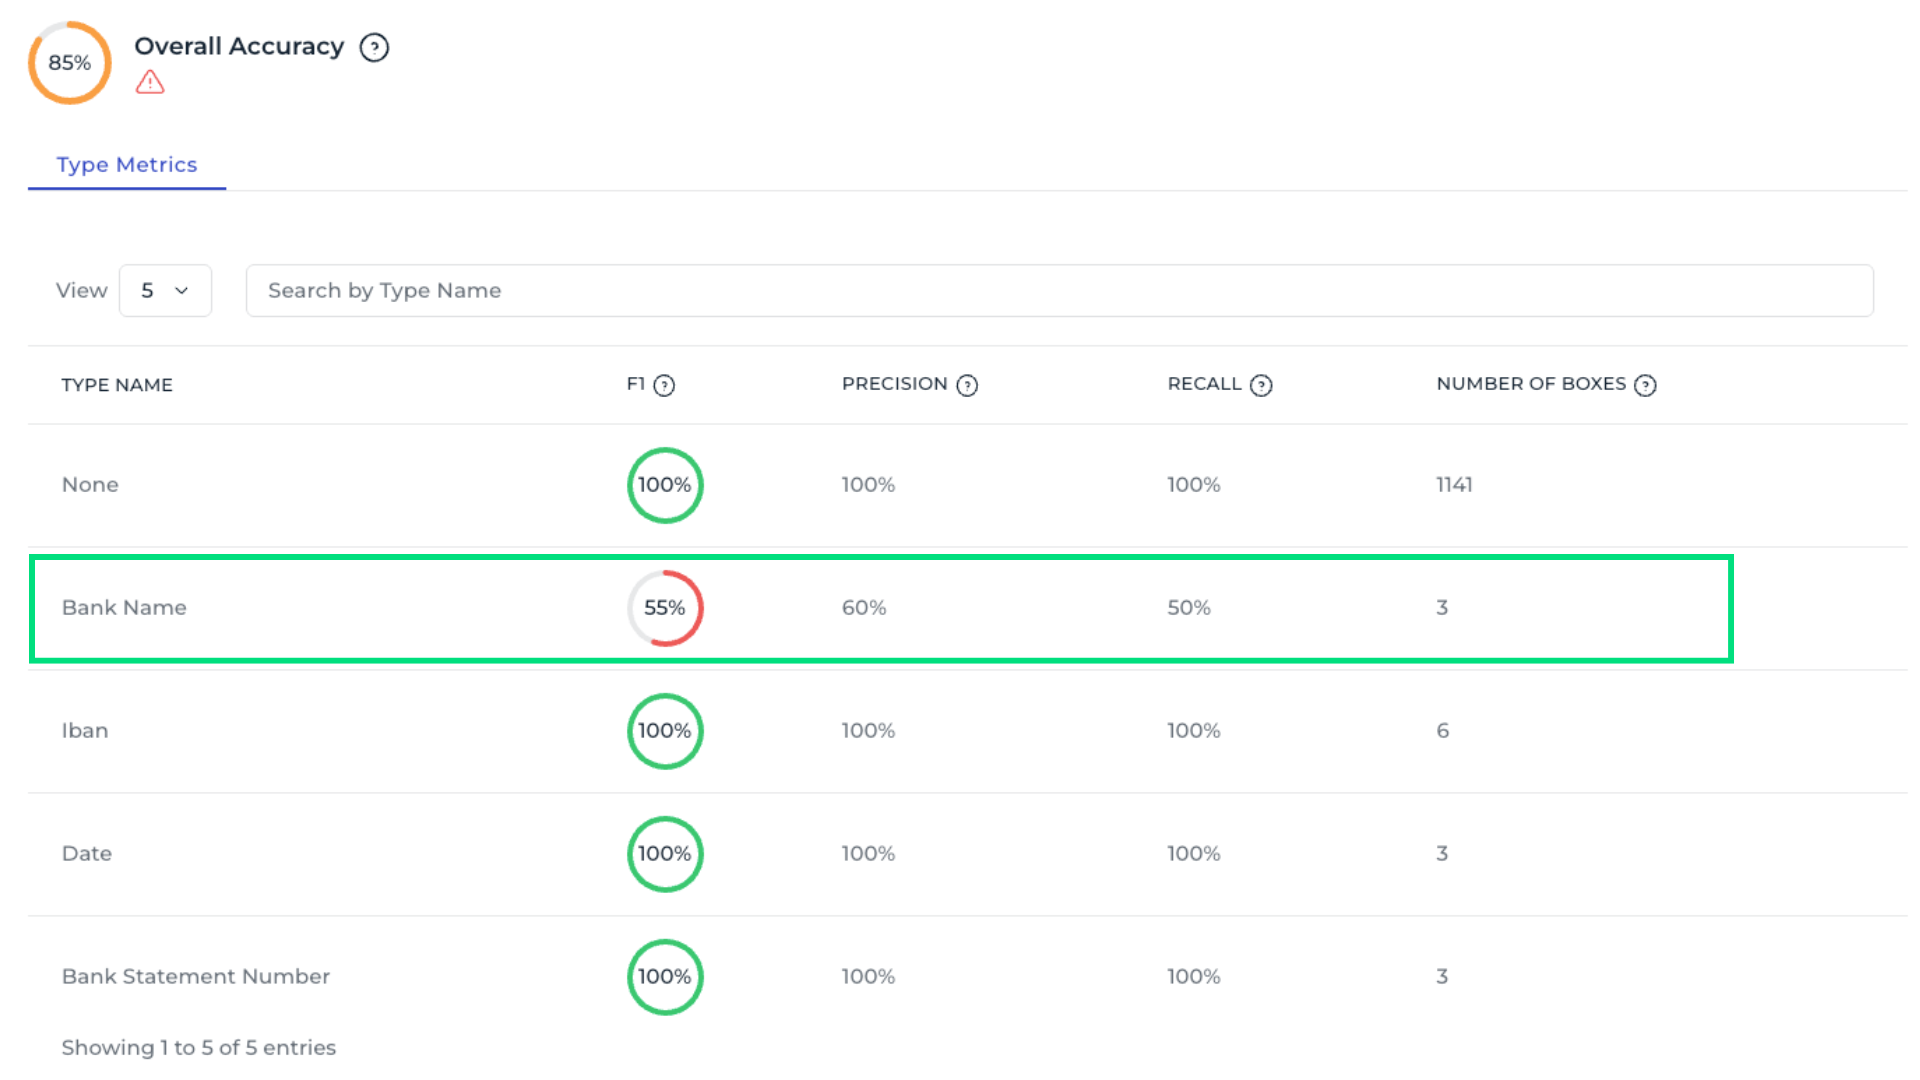
Each field provides several metrics that indicate different performances of the AI model.:
Number of Boxes: Indicates how many bounding boxes of this type are in the validation set. Low metrics with many boxes suggest the type performs poorly; with few boxes, low metrics might be coincidental, so adding more samples could help.
Recall: It measures how often the model correctly assigned this type to the text boxes that should have it.
Precision: Precision measures how often the model is correct when assigning a type to a text box.
F1-Score: F1 score is the combined mean of precision and recall, providing an overall measure of model performance.
A field such as Bank name may show lower values, indicating the need for annotation improvements or more training data.
5. Check aggregated field metrics
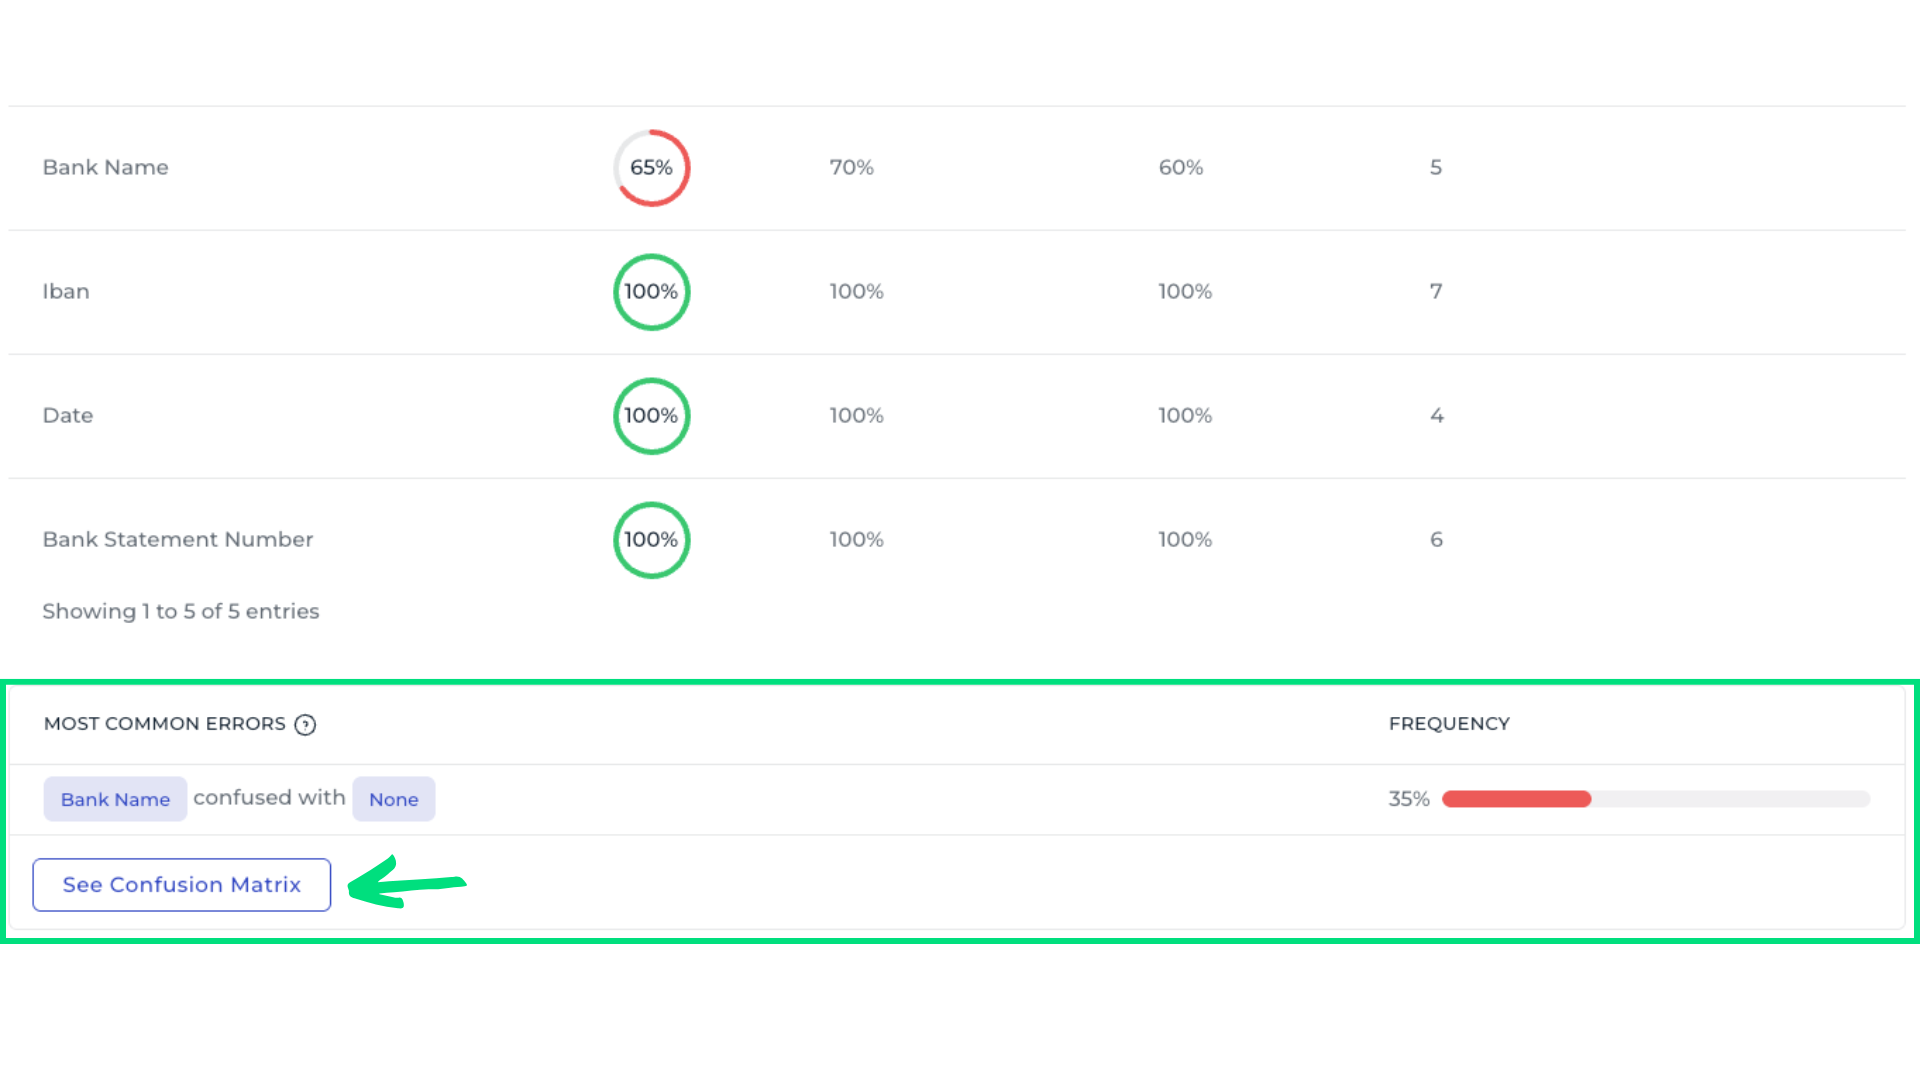
Use See Aggregated Detailed Metrics to analyze field performance across all templates. For example, the Bank Name field shows an overall accuracy of only 65%, indicating it requires closer attention. Scrolling to the bottom reveals the most common errors, showing which data fields are most often confused.
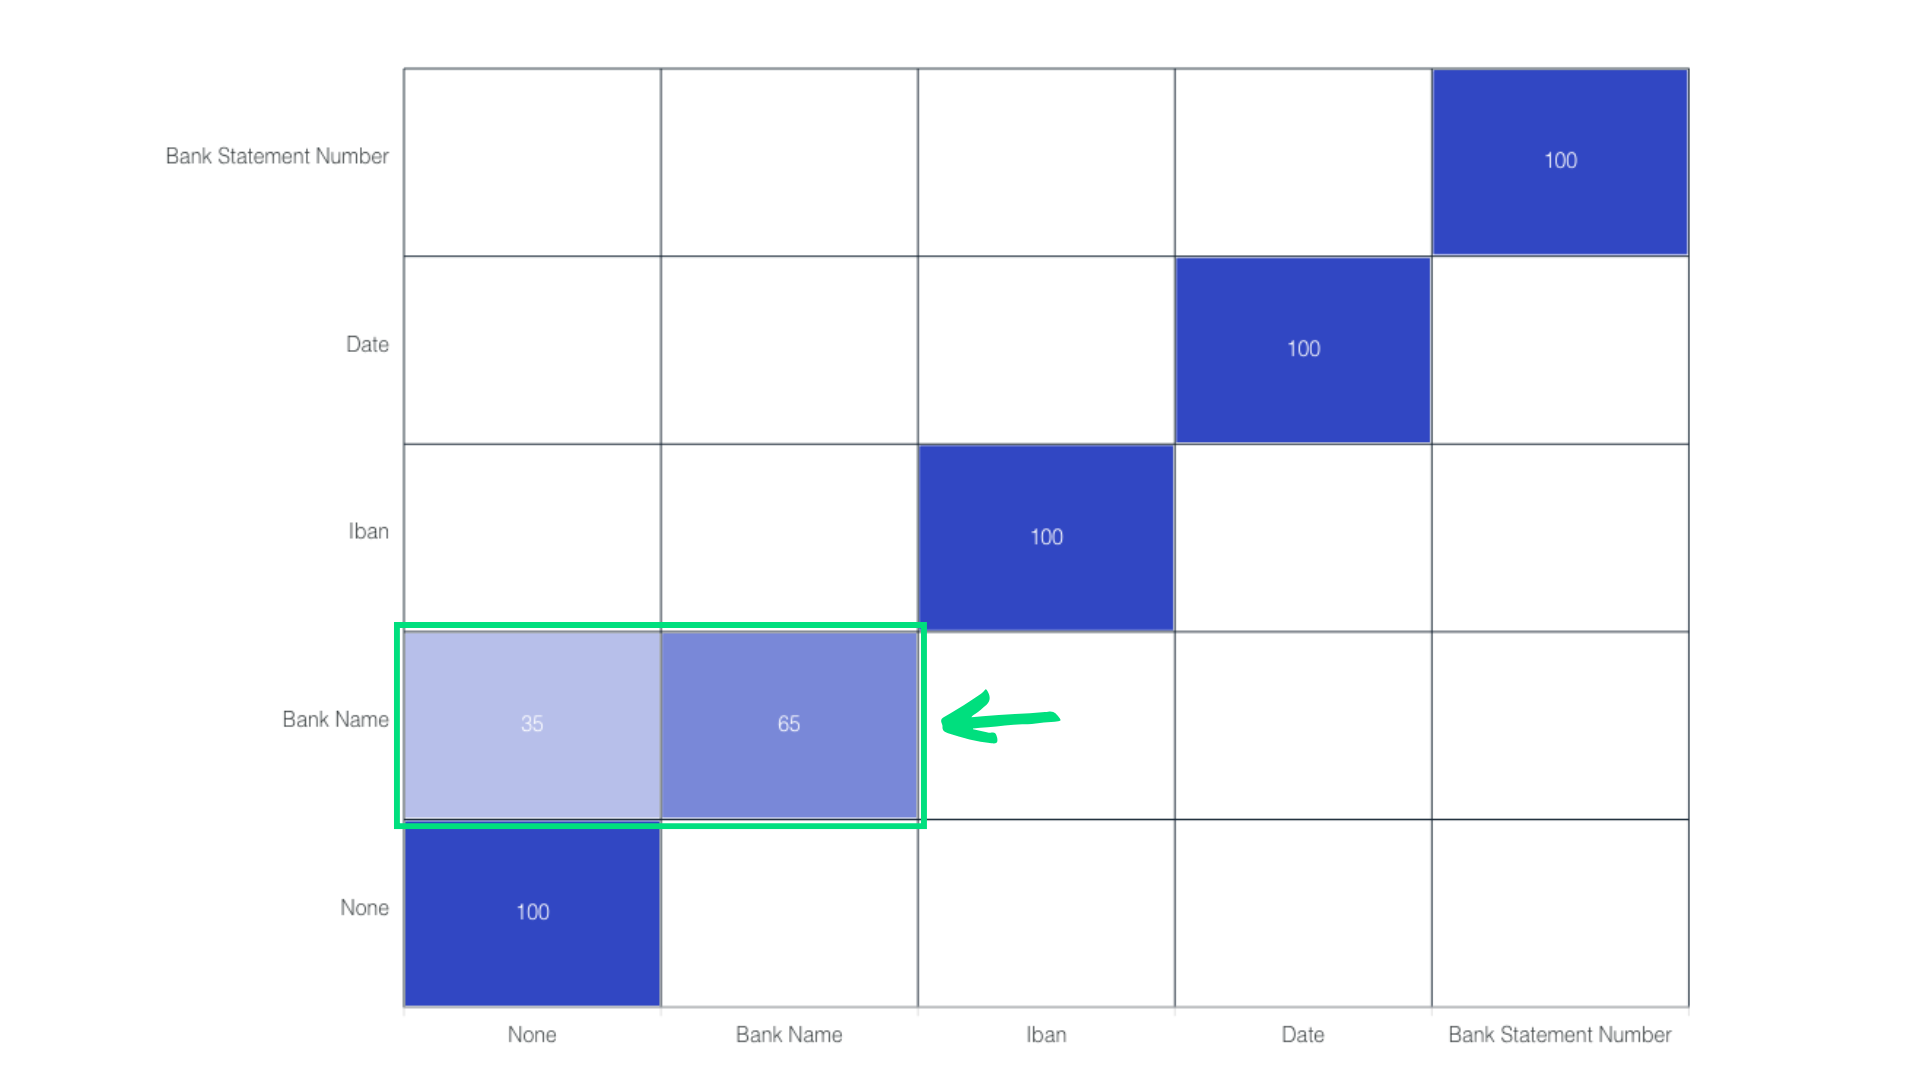
6. Inspect the confusion matrix
It shows the model’s performance by comparing predicted outcomes with actual outcomes. For example, examining the Bank Name field reveals that only 65% of entries are correctly recognized, with many being misclassified as None. This information helps identify which fields require annotation review or additional training samples.
7. Improve model performance
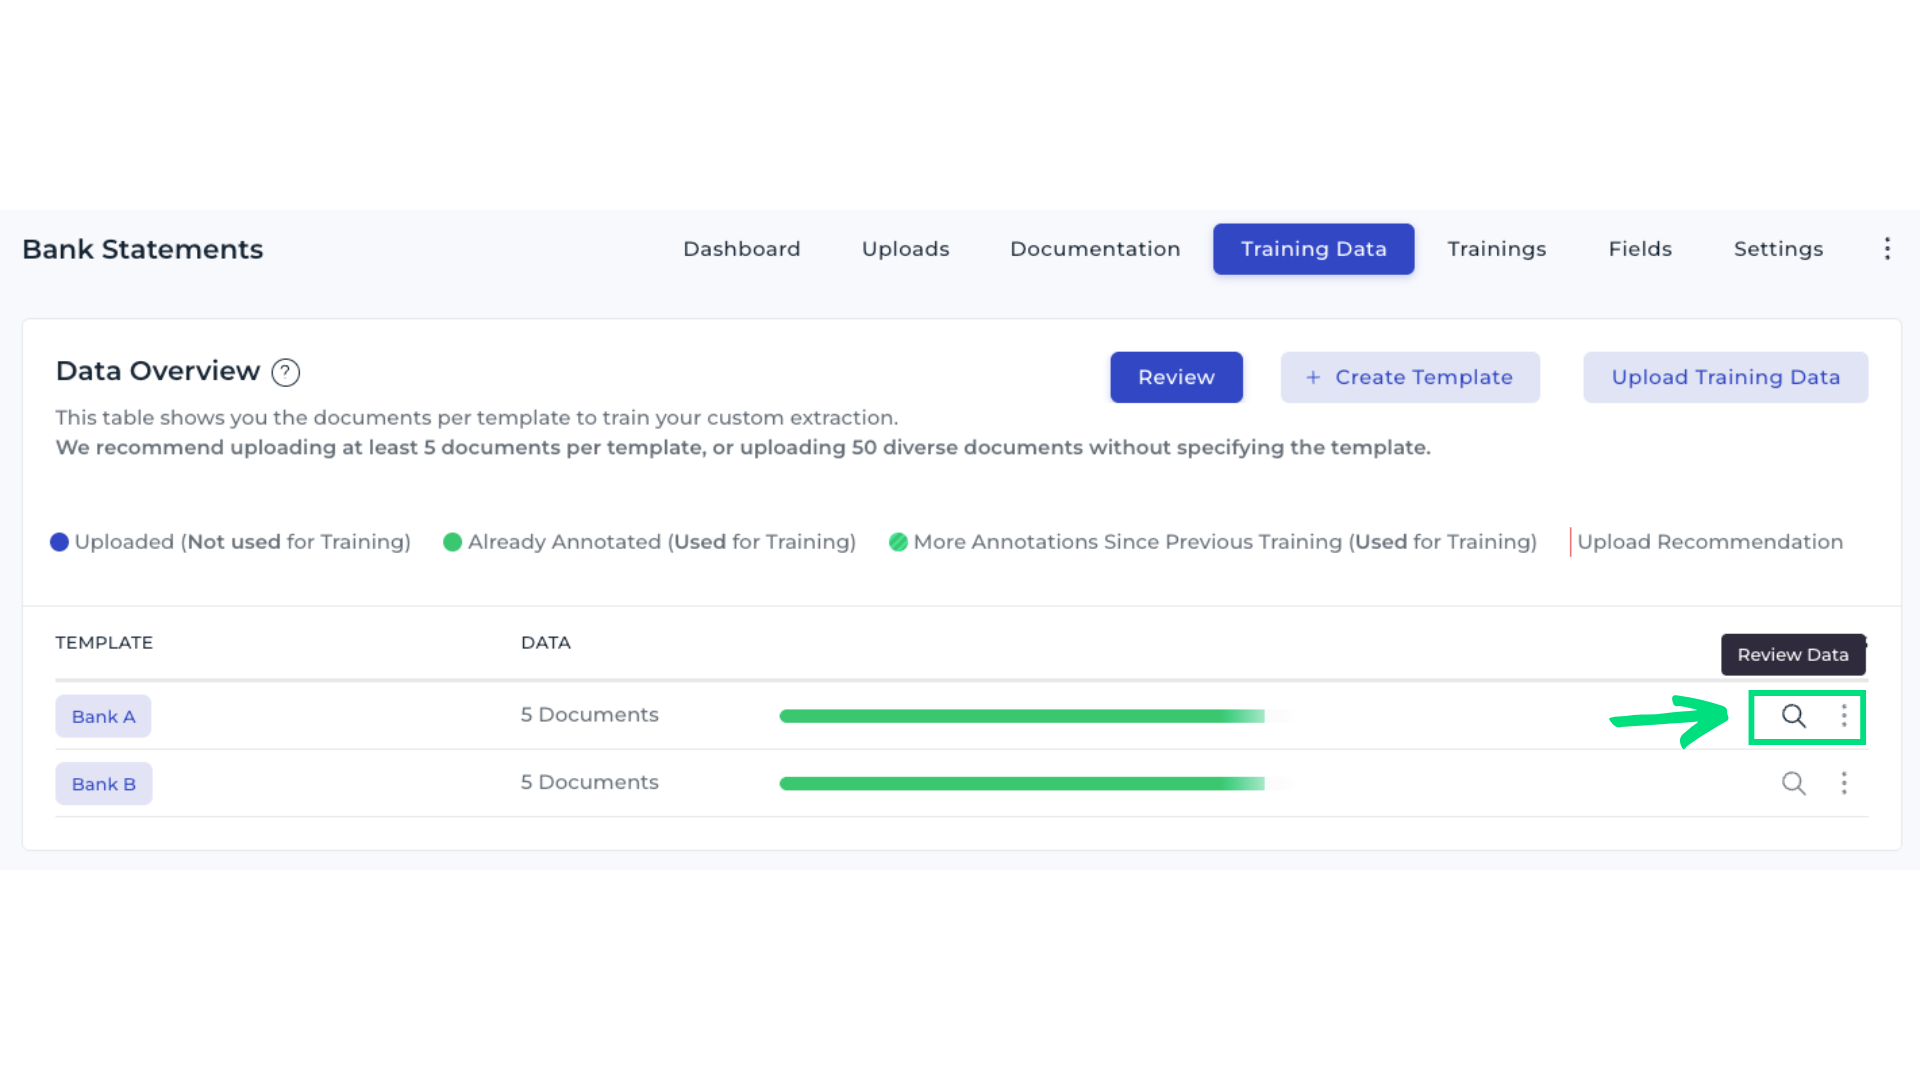
Open the Training Data tab and select Review Data in Template Bank A.
Inspect documents and check the annotations for the field Bank Name.
Add more training samples to give the AI more examples. Save your changes, and start a new training run once the review is complete.
Next steps
Review training metrics regularly. Focus the optimization on templates or fields with low accuracy. Add or correct training data as required until the model meets your performance expectations.
Metrics glossary
Number of Boxes: Indicates how many bounding boxes of this type were in the validation set. If the metrics are low even though there are many boxes, it indicates that this type really works badly. If the number of boxes is low and the metrics are low, it might just be a coincidance. In this case, more samples of this type must be added.
Precision: Precision measures how often the model is correct when assigning a type to a text box.
Recall: Recall shows how often the model correctly assigns this type to the text boxes that should have it.
F1-Score: F1-Score combines precision and recall to provide an overall measure of a model’s performance. It is the harmonic mean of precision and recall, considering both metrics equally.